
Person-action-object visualizations are incredibly useful. Yet they are typically artificial – unless used with long numbers and history. Using PAO with long numbers is central to memory sports. PAO of history requires additional explanation. In a way, some legal and accounting documents follow very similar structure with few adaptations.
Want to explore and enhance your memory skills? Dive into the wonders of unlocking your memory landscapes with some awesome techniques inspired by the ancient art of memory. Check out my Memory Masterclass . You do not have to pay the full price. Contact [email protected] and ask for a deep discount. Just a heads-up, since this is an advanced technique, it’s best if you have some basic memory training under your belt before giving it a shot.
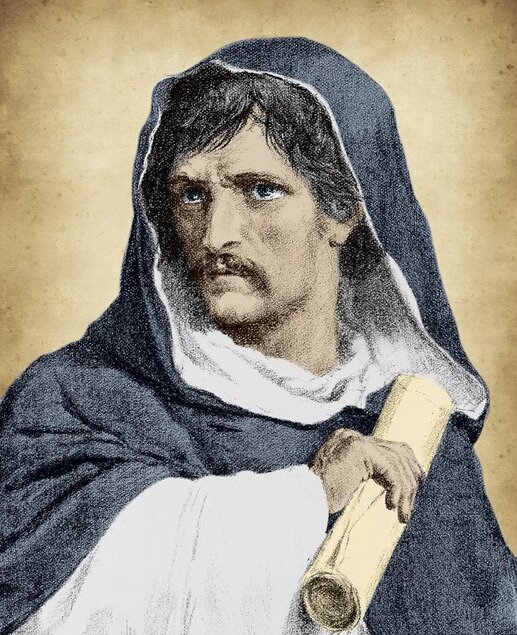
Person-action-object as a statue
In the sense of historical events, the person-action-object connection is natural. Most historical events are associated with prominent leaders that do something very special. However, it is hard to encode the very specific actions of leaders beyond the relevant tools. So the statues we see in city squares anywhere in Europe are often just that: a person with very colorful clothes holding some very unique object.
If we write down “Columbus discover America statue” we get the historical figure of Columbus with a globe and maybe a pointing figure. This is a starting point of visualization, not a good memorable visualization. So we have Columbus holding the globe or Isaac Newton holding a ruler.
Next, we add name of the person – usually on the pedestal of the PAO. Since the name can be hard, we may want to divide it into syllables and put the relevant cartoon on the pedestal too. Possibly, we want to add the dates when the person was alive and his allegiance. The allegiance is usually a flag or a set of flags. Dates are typically 4 numbers and a sign. Here we can use the classical PAO for numbers or peg system and again put the relevant visualization on the pedestal. And that’s about as much as you can encode in a single statue.
The statues are reusable. So once you encode it, you can use it a lot.
Map it
Now we have a statue as a monopoly figure moving all around the map and interacting with other figures. Typically the map we visualize is contextual. If you think about Julius Ceasar, he moved all over the ancient world, but there is need to visualize the entire globe. And if we think of a specific campaign, there is a smaller area of that country. For a major fight, there is a still smaller map of the landscape. The maps are nested. We take a large map and open a rectangle within to see the next map. Some maps can be 2D and almost abstract, while other maps should be 3D to encode specific land features. It is useful to visualize on the map the key cities and the highlights of the relevant cities. Visualizing borders is less effective. We can use software like https://history-maps.com/. Borders move quite a lot, so approximate visualization of the areas of control and relevant size is usually enough.
Notice that actual maps are somewhere between mindmapping and the method of loci. It is a simplified projection of real locations with metadata. We travel the map enough with our statues to remember it as-is. If we do not get enough map playing, we might forget the map. The areas where nothing relevant happens will likely be forgotten in a specific context.
For example, the battle of Midway is pretty important. We kind of visualize the area. Around the same time, there was a second Kharkiv offensive and the Battle of Rzhev (“Rzhev Meat Grinder”) on the Russian front. Both were incredibly bloody and the soviets lost. I can assume that only WWII specialists visualize it. Around 300,000 Soviet soldiers lost their lives in each of these battles, as many as all American casualties in the entire WWII. We do not even discuss them. Nobody I know of tries to co-visualize them with the battle of Midway.
Label the map
Labeling the map is an important part of the process. Maps change. We need to put on the map both the location and the time. The location may be self-explanatory via the highlights, and the time via the main events. Or alternatively, we may want to attach a visualized label to the map, like a wax stamp with the relevant visualization. We may for example put the symbol specific to that event. For example, for Columbus’s voyages, we can put a caravella. This stamp is only a contextual marker and is kind of meaningless without the main events.
Play the events
Now we have a map and the people, the action starts. People move from one highlight on the map to another. They merge, they separate and they act – for example fighting. This motion is easily visualized as a movie with cutscenes. People arrive at places and we get a cutscene played. The cutscene often starts as zoom-in on the map, with a secondary label very accurately stating the time and place, usually at the bottom of the cutscene.
This time label may include year, day, and even a minute (2-4 digits for the time of day, 3 digits for day, 4 digits for the year). Possibly it is easier to remember the offset vs previous major event – at least as dual coding. Most of this information is known approximately, so we substitute sunset with say 7pm. Some guesswork facilitates visualization of the relevant PAO. And we need several PAO or pegs to encode the time. We may need another PAO group to encode the encounter. For example, person A attacks person B.
Typically as we zoom in on specific historical events the visualization becomes very detailed, like a 3D model on a table. We can put such visualizations in a mental palace accessibly immediately from the cutscene. Or we may use a palace instead of the cutscene. And in each room of the palace, we encode a specific stage of the event and its metadata. Do not tempt to use your home for the palace. As you acquire more knowledge, stages may be added or removed.
Metadata
History is not just a series of encounters between people, and not just dates and locations encoded as PAO. There is also a lot of metadata, like relative sizes of the forces involved or political factors for certain events. This data is usually highly hierarchical and may be encoded in multiple mindmaps.
The more metadata we remember, the better we understand the actual reasoning for the events, We may remember numerical statistics (as PAO), psychological state of mind (as emoji) and qualitative evaluations (as key performance indicators with partially full bars). All of these may change. And there may be complex diplomatic activities, further making memorization more complex.
Historians also remember specific artifacts and literary sources substantiating each event. This is a lot of data to remember.
Numerical PAO
There are lots of numbers to remember. For numbers, a simple PAO table can be used, like a PAO of memory masters. These PAOs are always placed in groups – as a part of some itinerary, even if this itinerary is very simple. Typically people use 2 digits for person, 2 digits for action, and 2 digits for object. An example would be “Frankenstein” “bending” a “mushroom” or “Picachu” “licking” ”candle”. The triplets of person-action-object are very personal.
To be honest I most of the numeric PAOs are used for time markers, so we do not need a full PA, I find encoding numbers 1-100 great for the person – as we can use anything from pop culture. Usually, it encodes the year, relative to some key event like the beginning or middle of some century. 1-12 nice for action [bending, leaking, tearing, punching, huddling etc], as in encodes month or hour. I do not like actions that involve secondary objects, like knitting or tasering – unless you need a huge range of numbers. The object usually encodes the day of the month or an hour. The 1-60 range is comfortable, for small handhold objects. If the range gets larger you may need to add differentiating details or some strange objects like toys of animals, weapons, and transportation devices. If you do not have the patience for it, simply imagine the person holding a clock with specific hour, minute and second on the clock.
I do not share my personal PAO, so you will need to look for examples on memory forums, and then get very comfortable with your own PAO. The smaller the PAO table, the easier it is to acquire and maintain.
Names
There is a separate group of systems for visualizing complex words, names of places, and so on. Once you get the visualization encoded, either mechanically as a PAO or as the highlight building of the location, you can reuse it.
Usability
You can use the description here as a complete recipe, but it was not intended for this use. Some of the variations I describe here are very comfortable, yet people do not immediately think of them. Think how you can adapt similar ideas to your own needs.

Get 4 Free Sample Chapters of the Key To Study Book
Get access to advanced training, and a selection of free apps to train your reading speed and visual memory