In various stages of our supercharged skill set, we need to use categories and attributes. Each time this is something different. Let us start to make some sense out of this mess. It is also an exercise in systematic thinking, a sort of converging creativity, for me. I will share my thought process, and allow transparency into some of my processes.
Associative recall
What do the categories and attributes remind me of in my courses?
- Mindmap, as a way of splitting the branches of the tree
- Chunking, as a way of grouping together similar items
- Positioning, as a way of visualizing companies in a competitive landscape, say for investing
- Taxonomy, as a way of attaching items to an existing structure of subjects
- Visualization details, as a way of memorizing ideas with details
- Pseudocolor, as a synesthetic device to filter and sort content, for example, according to thinking hats.
- Creativity exercise, as a way of modifying ideas by SCAMPER of the attributes.
- Productivity grouping, as grouping items with similar setup or items requiring the flow state.
- Prioritization, as the attributes of “important” or “urgent” that we attach to tasks.
- Emotional coloring, as the positive colors that motivate us or toxic colors that require cognitive diffusion.
- Categories for memorization, like different mental palaces and their schemes.
- Typological categories: statistics vs propositional calculus, logical vs creative, introverted vs extroverted.
- Categories as contexts, for example, at home vs at work, or a specific scientific subject…
OK, I am doing this for a couple of minutes already and I have a pretty good idea of some contexts I want to mention.
Reread the diary entry and think about the original context
In my diary entry, I wrote the following idea for an article: “Do not think in terms of category. Try to take attributes. Two attributes define a plane. Enum attributes define clusters.” Sounds cryptic, but I recall the context. I wrote it during the construction of the new analysis and creativity course when formulating an answer to a student.
What I meant was very simple: instead of building your ideas top-to-bottom using categories, try building the idea bottom-up using shared attributes of the objects. The student asked for further clarification. As a metaphor, I provided a grocery list, where you do not want to run between the store departments, so you organize the list not alphabetically like an index but by the department.
An additional question was generating my own taxonomies (or category structures) when the “departments” are not a-priori known. And, I wanted to discuss discrete vs continuous attributes.
Organizing my thoughts
At this point, I try to think which theory that I know (or can easily create) addresses the subject. Anything that does not belong to the theory goes back into the diary of ideas for future articles.
There are several theories I know that are extremely generic: Bloom’s taxonomy, Octalysis, Universal theory of knowledge. They are too generic for this discussion. Instead, there is a creativity theory that deals with definition of the engineering problem. The theory is impossibly abstract ARIZ, and the subject is called “functional analysis and pruning“.
You will not find me talking about complex and abstract algebraic and physical content, but I often use it for my own sake. So another idea I have here is similar to Platonic caves or the way information can be projected through the event horizon of the black hole.
Taking a break
Somehow I often take a break in the most interesting part: when the thoughts start to crystalize but are not fully clear. It’s not even a plan. I get interrupts. Family, students, home, employees, projects, collaborators… It is hard to get more than 20 min of time without interrupts unless this is a planned flow. If this was a planned flow, I would work into the night when everybody else is asleep. But it is the middle of the day, so I had half an hour of interrupts to deal with everything I do not like to deal with.
One of the reasons I am so effective is the need to deal with constant interrupts. If I cannot do what I need to do when I have the opportunity, I simply do not make enough progress. So I speedread and speedwrite, and speed everything else to make the most of the time I get between the interrupts. This is not what I teach, and not what I like. The situation was much better before COVID19, but we need to do the best with the cards we get.
I use the breaks to review and rethink my strategy. This is a cool creative step, even if it was not planned. After a break, I always come up with new ideas.
Reality as projection
What we see as one complete reality is in fact a combination of factors. My metaphor here is the RGB projector. Each lamp of the projector sends a different image in a different color to the same location. As a result, we get a mixture of three colors per point, and these are the attributes of each point on the screen. Now we can measure the color attributes of each point and aggregate the points into shapes. Alternatively, we can see the shapes, and try to assign the color attribute, like “blue sky”.
The color attributes are measurable, the categories are there because we have a lifetime of experience. In a similar way, if I throw you a bag of letters, you may generate words or statistics or categorization into vowels and consonants. Each form is correct in its own way. We project our inner vision, the way we want the reality to be, on our sensory inputs.
If you see a blue sky this will not provide a lot of information about the specific RGB value of a relevant pixel. And if you combine RGB values of 10 pixels, you may not be able to determine the object. However, these sources of information complement each other. We build our understanding top-down and we collect supporting information bottom-up.
From metaphor to manifestations
Once we have a generic “vision” of the subjects outlined as a metaphor, we provide a context for specific manifestations. Here the focus is on details.
The category or attribute can be very practical. Consider a grocery list. We can group items like meat, dairy, and vegetables, or we can address the practical aspect like do we need refrigeration. Both ways are important, simple the first set of attributes is used to find the items and the second to put them into our own storage.
When we talk about datasets, there can be inherently continuous attributes and labels. Every pair of continuous attributes defines some parameter plane for visualization. Each label allows to sort of filter similar items. For example, we can select only dairy items and sort them by weight and cost. In this example, we want to buy cheap items (cost per gram) that we can eat (weight constraint) and pay for (total price constraint). The price ranges are very different in each category.
Complex example
Once the simple example is clear, I love to add some complications. These complications make my work interesting and my examples less theoretical.
If we want to cook some sort of dinner, the items are grouped very differently. Cheese is allocated to sandwiches and butter to the cake we want to cook. Or in any other way. We know approximately the allocation of each item between different dishes, and we know which dishes we can make from each item.
Either we start from the ideal list of dishes and that builds the grocery list, or we start from the items in our fridge and that will build the relevant dish list. Both ways will be imperfect and we may need to complement whatever we have in our fridge with new purchases.
Each kind of dish is its own category and there is a cross-reference object between dishes and ingredients.
Optimization criteria
While I know that no ideal solution is usually available, I add this chapter as a hint for possible solutions.
To make things worse, every item we have has a different expiration date and we do not really want to throw away the expired items. So cooking immediately becomes a complex optimization exercise even before we add all other complications.
We have
- a mental palace of the department store and its categories,
- a mental palace of our own refrigerator with its shelves,
- a mindmap of the inventory by any attribute we fancy,
- a mindmap of the desired dishes by the appetizer, main course, and dessert,
- a cross-reference between dished and ingredients,
- graphs of labeled ingredients and their costs,
- constraints on quantity, size, and price,
- other criteria I am too lazy to mention.
The crazy thing here: every housewife knows to deal with this crazy list of objects, features, and mental structures. Some deal better than others, but most solutions are workable. You can optimize for lower cost, better nutritional values, taste, or satisfaction. Probably you will not find THE BEST solution, but you will be able to manage.
Now get the same thing in a form of a public corporation annual reports for several blue chip companies. The complexity of the task is similar, but how many of us can handle it?
Overcoming mental barriers
My call to action would be: buy my courses. But if I would say that, most people would call me bad names. So instead I provide a little gift, a small “Aha” moment, hoping that you will want to give me a small gift in return. If you read many of my articles and enjoy them, I hope the emotion will grow.
The basic barrier we need to overcome on our way to mastery is one of abstraction. When we can visualize complex economic principles in a way similar to a grocery list, we will be able to find workable solutions. Only we cannot reuse the grocery list metaphor literally. We may want to “feel” interest rates like we feel fat and diet cheese, or cost of sales like the size of container with respect to what is in it. If so, EBITDA is what I find on my plate after my kids have eaten and before my wife asks me to share. Or you may go with a very different combination of metaphors.
We have multiple representations of the complex knowledge by different criteria, yet the main difficulty is not the data. The main difficulty is our own ability to “feel” the data, and this is something experts do much better than the general public.
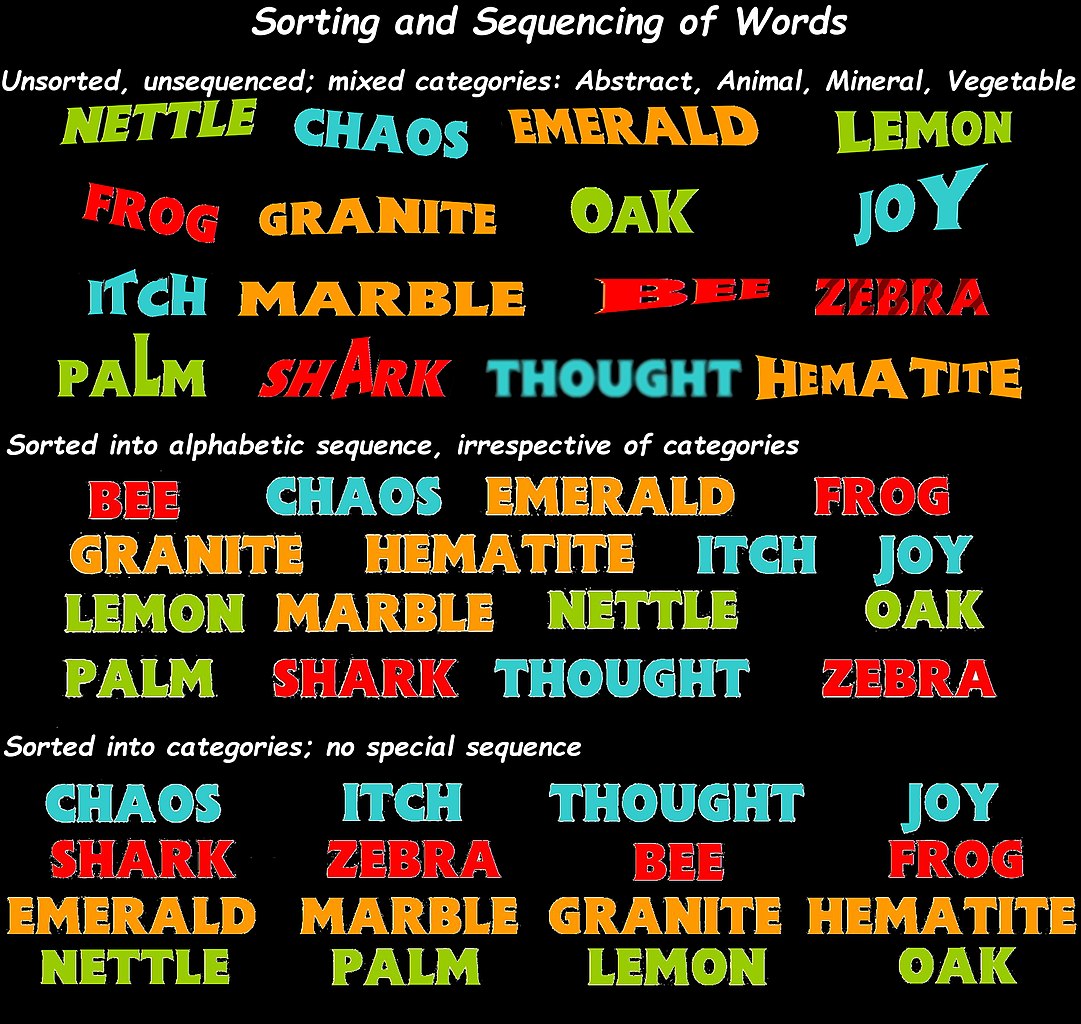
And in the end, I provide a visual map of something very different, to let you think…


Get 4 Free Sample Chapters of the Key To Study Book
Get access to advanced training, and a selection of free apps to train your reading speed and visual memory

